
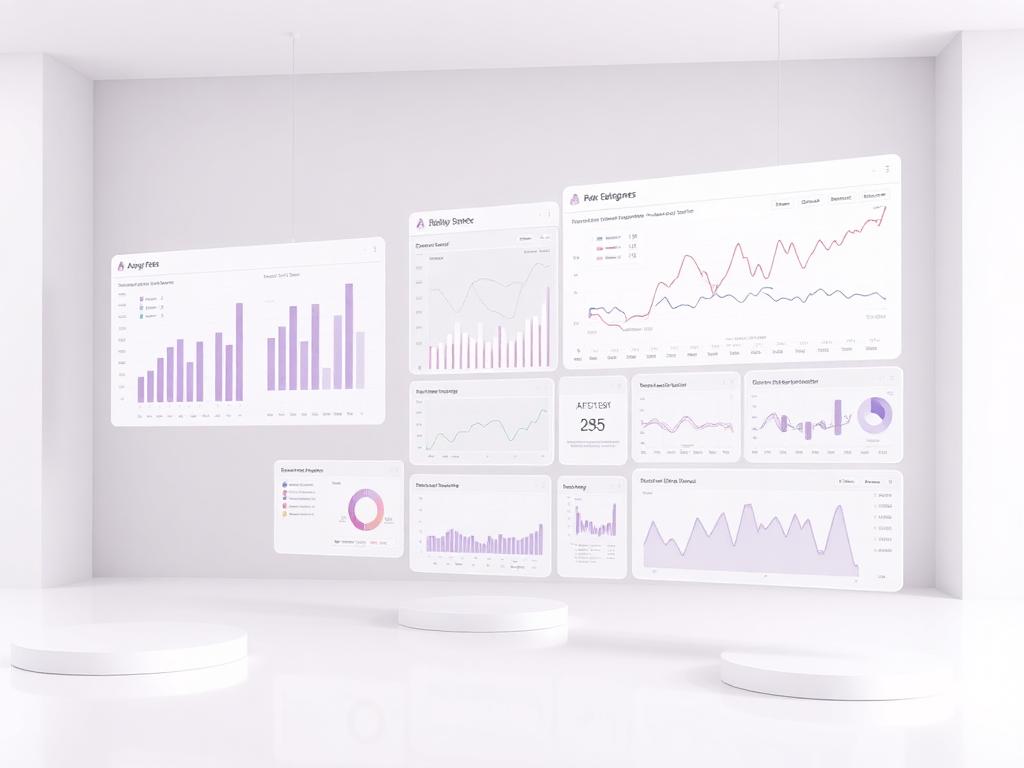
Dashboard sprawl
Dozens of reports, no agreed definition of the numbers that matter.
Data & AI
Dashboards are only useful when they answer the questions a team is accountable for. TechRBM designs analytics models, metrics and visual experiences that connect operational data to the decisions leaders and frontline teams make every day.
The challenge
Dozens of reports, no agreed definition of the numbers that matter.
Two teams presenting different values for the same KPI in the same meeting.
Reports that explain what happened but never suggest what to do next.
Analytics built for analysts rather than the people who need to act.
Our approach
Map the decisions, owners and cadence each dashboard is meant to support.
Agree on definitions, grain and calculation logic once, then reuse them everywhere.
Build visual hierarchies that surface exceptions and trends, not just totals.
Refine with the teams who use the reports in their weekly operating rhythm.
Capabilities
KPI and metric framework definition
Semantic models and reusable measures
Executive, operational and self-service dashboards
Embedded analytics inside business applications
Ad-hoc and exploratory analysis enablement
Predictive and statistical analysis where the data supports it
Report performance tuning and refresh optimization
Technology areas
Related services
Tell us about your technology, data, AI, cloud or software requirements and we'll map out a practical path forward.
Talk to TechRBM